A window full of parallel agents is a window full of processes, and when the fan spins up the useful question is which one. Activity answers it: a process monitor that only knows about Termic, grouped the way you think about your work rather than the way the kernel lists it.
Open it from the Activity button in the sidebar footer, or Activity monitor in the command palette (⌘K).
It is a real window, not a modal, so the numbers keep moving while you drive the agent that moves them. Sampling happens only while the window is open, and backs off to every 5 seconds while the window is occluded.
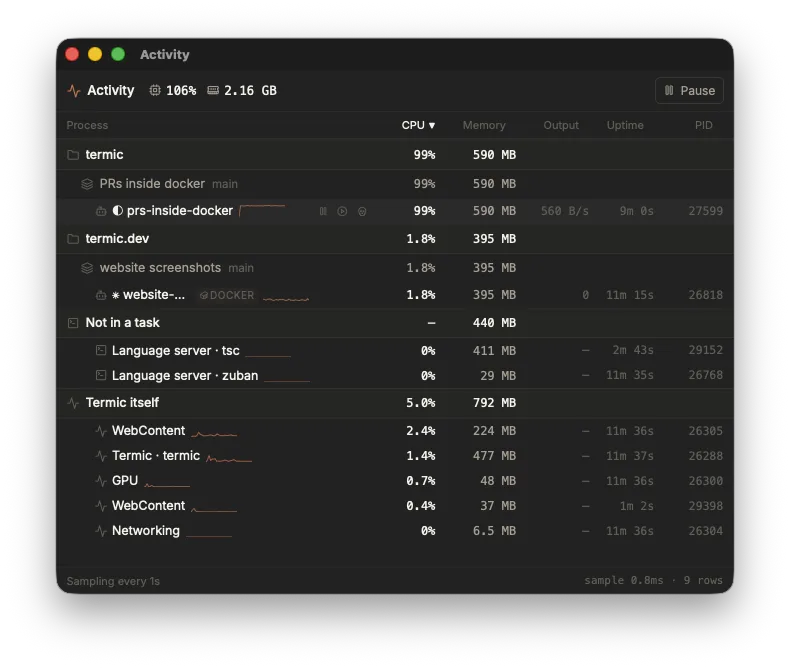
Grouped project, then task, then the agents and shells inside it, CPU descending by default, so the row spinning the fan is the top one. The language servers sit in a group of their own because they belong to a checkout rather than to any one task.
The tree
Rows are grouped project, then task, then tab, and each row is named after the tab it is actually showing: its renamed title, or the live status text the tab strip shows. Several tabs running the same CLI in one task therefore do not look identical, which they did before.
CPU and memory are rolled up over the whole process tree under each agent, not just its top process, so a CLI that forks helpers is charged for them. The per-child breakdown is in the row’s tooltip when you want to see where it went.
The rows under a task are the things Termic spawned there: the agent CLI, any shells, and any run or setup scripts. Termic itself gets its own group, covering the app process and its WebKit sidecars, rather than being taken on faith.
Not in a task collects what Termic runs for a checkout rather than for one task, which in practice means language servers. One server answers every task sharing that checkout, so charging it to any single one of them would be a lie.
The columns
| Column | What it tells you |
|---|---|
| CPU | Smoothed, so a row does not flicker between 0 and 90 every sample |
| Memory | On macOS this is phys_footprint, the same number Apple’s own Activity Monitor shows, never a sum of RSS. On Linux it is VmRSS |
| Output | Terminal output rate, which is how you spot the agent flooding a pane |
| Uptime | How long it has been running |
| PID | For when you want to go and look at it yourself |
Every column sorts, CPU descending by default, so the culprit is the top row. A group sorts by the same column its rows do, so the ordering means the same thing at every level of the tree.
CPU is deliberately smoothed rather than raw. A sampling monitor that reports instantaneous CPU produces a table that is visually busy and tells you nothing about which process has been busy for the last minute, which is the actual question.
Acting on a row
Each row can be:
- Paused (
SIGSTOP). The process stops dead and nothing is sampled from it. Useful for an agent that is burning CPU while you decide what to do about it. - Resumed (
SIGCONT). - Stopped (
SIGTERM).
A paused row says so, rather than appearing to sit at 0% CPU for reasons unknown.
What it is for
Two things, mostly:
- Finding the expensive one. Six agents running and one machine getting hot: the CPU column names it in a second, and the row tells you which task it belongs to.
- Understanding what a language server costs. Code navigation servers hold their index in memory while they run, and the memory column is where that stops being an abstract warning and becomes a number for your repository.
Related
- Parallel agents: the thing that makes a process monitor necessary.
- Code navigation: the servers whose memory shows up here.
- Scripts: setup & run: the other processes a task spawns.
- Tasks & worktrees: what the grouping follows.